Overview
The floating percentile model (FPM) is a tool for developing freshwater sediment quality benchmarks (SQBs). It was originally developed by Avocet and SAIC (2002) for use by the Washington State Department of Ecology as a Microsoft® Excel macro (Anderson and Michelsen 2011). SQBs are often non-site specific and tend to err on the side of conservatism rather than accurate toxicity prediction. While the FPM has been used to develop non-site-specific benchmarks (Ecology 2011), it is primarily a site-specific tool. Site-specific FPM benchmarks should theoretically be more accurate at predicting toxicity than default freshwater benchmarks (e.g., Probable Effect Concentrations) by taking into account the relationship among site toxicity, chemistry and, to some extent, the underlying bioavailability of chemicals.
The FPM software is a “black box” with limited user control and locked access to the tool’s underlying code. It is also not widely available for public consumption. The RFPM package, a reimplementation of the FPM in the R statistical environment, represents an effort to expand user controls as well as release the FPM code for immediate public use and evaluation.
Windward developed the RFPM package independently (Church and Detering 2022), and we presented our work at the 2022 SETAC North America conference in Pittsburgh, Pennsylvania (Detering et al. 2022). The RFPM package (version 1.0) is now available and can be freely downloaded through R or from the Comprehensive R Archive Network website: https://cran.r-project.org/web/packages/RFPM.
Windward developed the RFPM with the following goals:
- To better understand the behavior of the FPM when applied using different datasets and sensitivities to each model parameter
- To make the FPM tool more broadly available in a free and open-source R package
- To improve model adaptability to skewed (or symmetric) datasets by using statistical tests applicable to the input data (rather than requiring parametric test assumptions with or without outlier removal)
- To supplement the FPM with new functions to visually and statistically evaluate input data and benchmarks, as well as optimize model parameters to improve benchmark accuracy
- To address a minor problem in the original code that can lead to incorrect benchmark outputs
Windward has developed a package vignette for the RFPM that illustrates an example workflow for sample datasets, as well as recommendations, rationale, and limitations for FPM benchmark development based on our extensive investigations of model sensitivity and variability. That vignette can be found here: https://cran.r-project.org/web/packages/RFPM/vignettes/RFPM.html
FPM Detail
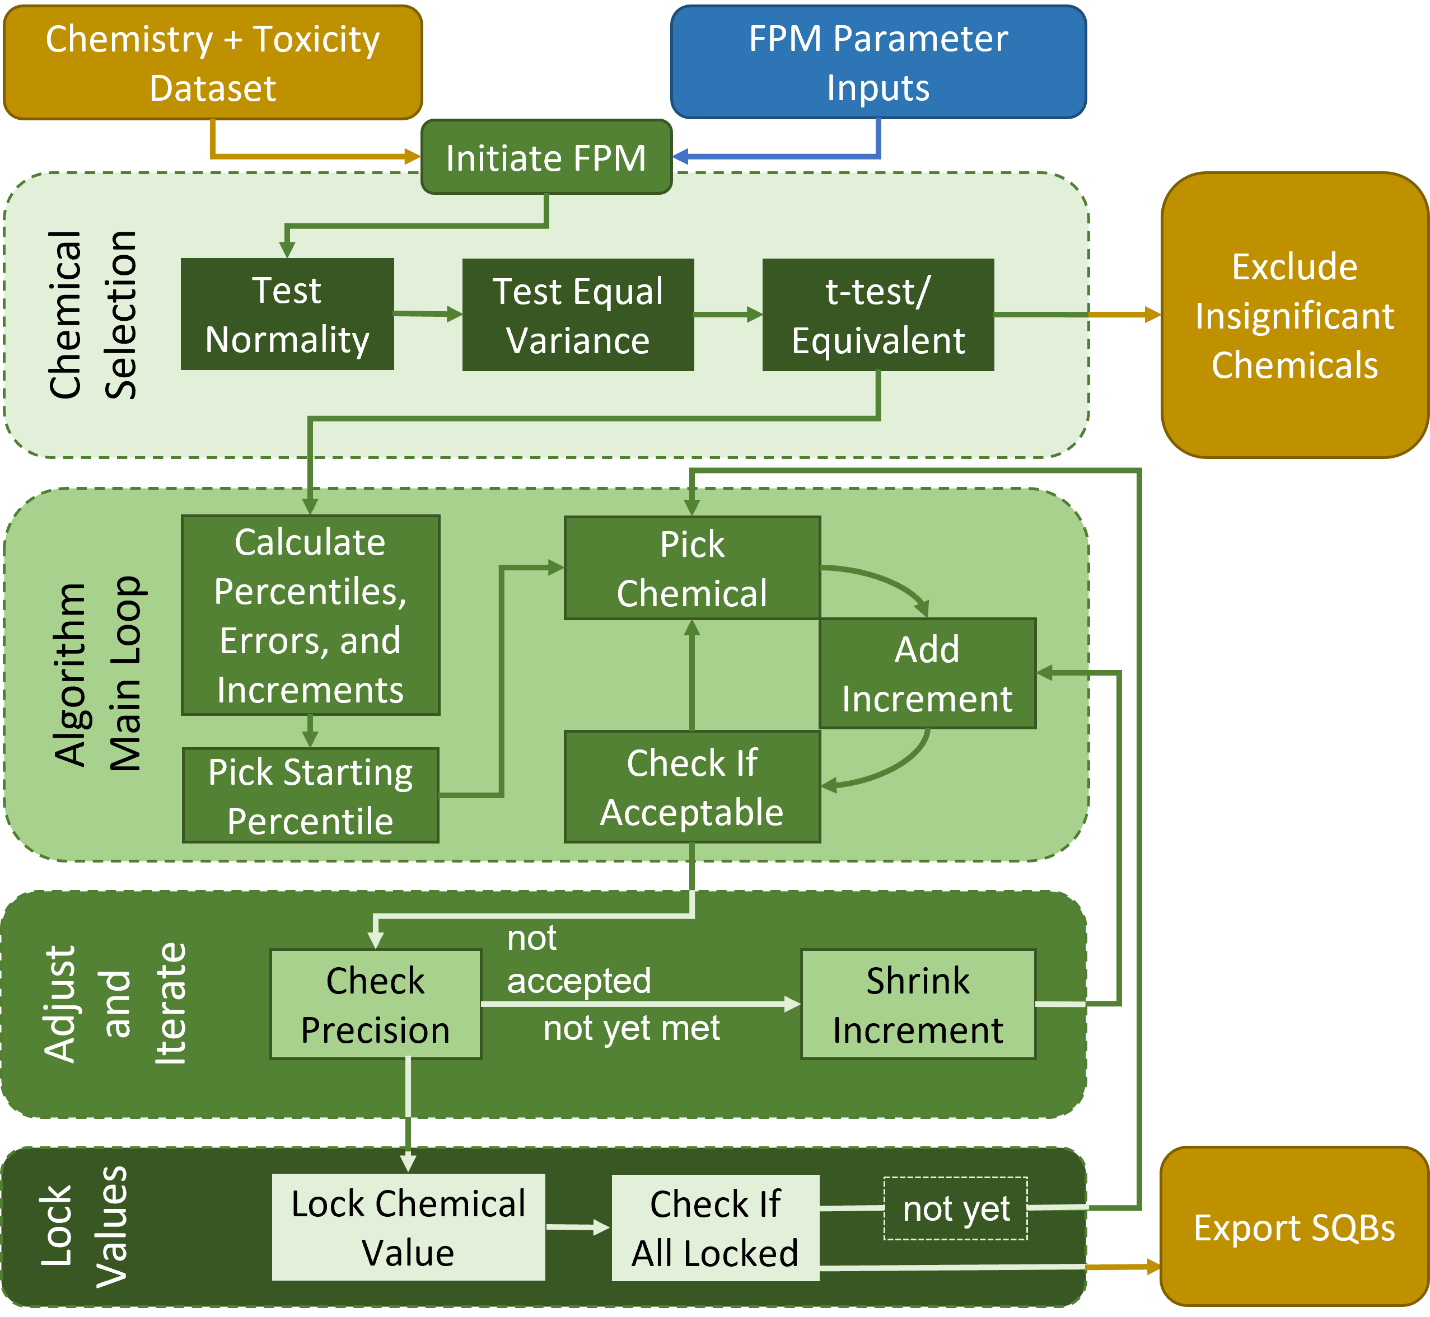
A visual representation of the FPM is provided below. The algorithm follows several distinct steps:
1. Selecting chemicals with significantly higher concentrations among toxic sediment samples
2. Calculating relevant statistics and parameters (used in the third step of the algorithm)
3. Running the relevant statistics and parameters through two connected loops, which compose the SQB calculation step.
a. The first loop involves iteratively increasing preliminary benchmarks and testing whether each increase is acceptable.
b. The second loop involves iteratively reducing the amount of the increase in the first loop until either an acceptable increase is determined or the value is locked in place (i.e., determining that there is no acceptable increase).
4. Exporting benchmarks and related statistics (e.g., toxicity prediction accuracy)
Downloading the RFPM
There are several options for downloading the RFPM, the most straightforward of which is to paste the following code into the R console (or into the console provided by RStudio):
install.packages(“RFPM”, dependencies = TRUE)
This code will install the RFPM and all packages that it depends on (i.e., dplyr, knitr, lawstat, and reshape2), if they are not already installed.
If using RStudio, users can navigate to the Packages window, click the Install icon, type RFPM into the prompt, and then click the Install button. The user must confirm that the Install Dependencies box is checked prior to clicking Install. If the Packages window is not visible, users can navigate there from the View drop-down menu (i.e., Show Packages) or using the hotkey Ctrl+7. Another way to open the Install prompt is to navigate to the Tools drop-down menu and selecting Install Packages….
Lastly, the RFPM package can be downloaded outside of R as a tar.gz file. The tar.gz filetype is recognized by R as a package, but the file must be added to the package directory in the user’s selected package repository. Given the complexity of this option, we recommend that users download RFPM using one of the first two options.
Contact Information
For questions or problems related to the RFPM package, please contact:
John Toll
References
Anderson MR, Michelsen T. 2011. Description and use of the RSET floating percentile method spreadsheets. Updated March 4, 2011. Avocet Consulting.
Avocet, SAIC. 2002. Development of freshwater sediment quality values for use in Washington State. Final report. Publication No. 02-09-050. Prepared for Washington Department of Ecology. Avocet Consulting, Kenmore, WA and Science Applications International Corporation (SAIC), Bothell, WA.
Church B, Detering C. 2022. RFPM: floating percentile model [online]. Updated November 14, 2022. Available from: https://cran.r-project.org/web/packages/RFPM/index.html.
Detering C, Church B, Toll J. 2022. Redevelopment and improvement of the floating percentile model in the r statistical environment for the calculation of site-specific sediment quality benchmarks. SETAC North America, Pittsburgh, PA, November 13-17, 2022.
Ecology. 2011. Development of benthic SQVs for freshwater sediments in Washington, Oregon, and Idaho. Publication no. 11-09-054. Toxics Cleanup Program, Washington State Department of Ecology, Olympia, WA.